Keltner Channel

Keltner Channel

Der Keltner-Kanal ist ein Verfahren der technischen Chartanalyse. Er wurde erstmals 1960 von Chester W. Keltner (1909-1998) eingeführt. Er dient der Veranschaulichung von Kurspotentialen und wird als Analyseverfahren u.a. vom VTAD als Berechnungsmethode verwendet.

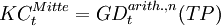
Ähnlich wie bei den Bollinger-Bändern wird der Graph von oberen und unteren "Bändern" eingekreist. Zuerst wird ein gleitender Durchschnitt gebildet, die Basis hierfür bildet der sog. typische Preis.

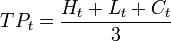
Berechnung des typischen Preises:

Die Summe aus Tageshöchstkurs, Tagestiefstkurs und Schlusskurs wird durch den Wert 3 geteilt, um so einen Tagesdurchschnittskurs zu erhalten.

TP_t=\frac{H_t+L_t+C_t}{3}


Im zweiten Schritt wird der Tageshöchstkurs vom Tagestiefstwert abgezogen, man erhält auf diese Weise den Durchschnittswert der täglichen Handelsspanne. Dieser Wert ist ein Maß für die Beweglichkeit und kann durch Multiplikation mit einem Faktor an unterschiedliche Anwendungsbereiche angepasst werden. Dieser Faktor F wurde jedoch erst später eingeführt; wird der Faktor gleich 1 gesetzt, so entspricht dies der Originalformel. Keltner berechnet den gleitenden Durchschnitt und die tägliche Handelsspanne für 10 Tage.

Interpretation

Bei einem Durchbrechen des Kurses des oberen Bandes soll dies auf eine mögliche Steigerung des Kurses in Zukunft hindeuten; bei einem Durchbrechen des Kurses am unteren Band auf ein weiteres Fallen des Kurses.

Eine Berechnung des Keltner-Kanals ist nur möglich, wenn Tageshoch-, Tagestief- und Schlusskurs bekannt sind.

Formeln

KC_t^{Oben}=GD_t^{arith.,n}(TP)+ADR_t^{m}xF

KC_t^{Mitte}=GD_t^{arith.,n}(TP)

KC_t^{Oben}=GD_t^{arith.,n}(TP)-ADR_t^{m}xF

Literatur

  • Oliver Paesler: Technische Indikatoren: das ideale Instrument für jeden erfolgsorientierten Anleger; Methoden, Strategien, Umsetzung. FinanzBuch-Verlag; [Bonn] : Investor-Verlag, München 2007, ISBN 978-3-89879-248-6.

Wikimedia Foundation.

Игры ⚽ Нужно решить контрольную?

Schlagen Sie auch in anderen Wörterbüchern nach:

  • Keltner channel — is a technical analysis indicator showing a central moving average line plus channel lines at a distance above and below. The indicator is named after Chester W. Keltner (1909 1998) who described it in his 1960 book How To Make Money in… …   Wikipedia

  • Keltner Channel — A volatility based envelope indicator that measures the movement of stocks in relation to an upper and lower moving average band. This indicator, named after Chester W. Keltner, is used by sophisticated investors to predict the trend of the… …   Investment dictionary

  • Donchian channel — The Donchian channel is an indicator used in market trading developed by Richard Donchian. It is formed by taking the highest high and the lowest low of the last n periods. The area between the high and the low is the channel for the period… …   Wikipedia

  • Commodity Channel Index — The Commodity Channel Index (CCI) is an oscillator originally introduced by Donald Lambert in an article published in the October 1980 issue of Commodities magazine (now known as Futures magazine). Since its introduction, the indicator has grown… …   Wikipedia

  • Turtle Channel — A trading band created by plotting the highest and lowest prices of an asset over a certain time period around the price of that asset. This indicator is interpreted in a similar manner to other banded indicators such as Keltner channels and… …   Investment dictionary

  • Канал Кельтнера — Пример канала Кельтнера. Канал Кельтнера[1] (англ. Keltner channel)  технический индикатор, состоящих из двух полос над и под скользящей средней ценового показателя, ширина которых определяется как доля от среднего изменения цены за… …   Википедия

  • Technical analysis — Financial markets Public market Exchange Securities Bond market Fixed income Corporate bond Government bond Municipal bond …   Wikipedia

  • Price channels — Trend channel A price channel is a pair of parallel trend lines that form a chart pattern for a stock or commodity.[1] Channels may be horizontal, ascending or descending. When prices pass through and stay through a trendline representing support …   Wikipedia

  • Dead cat bounce — For the Irish comedy rock band, see Dead Cat Bounce (comedy band). In economics, a dead cat bounce is a small, brief recovery in the price of a declining stock.[1] Derived from the idea that even a dead cat will bounce if it falls from a great… …   Wikipedia

  • Moving average — For other uses, see Moving average (disambiguation). In statistics, a moving average, also called rolling average, rolling mean or running average, is a type of finite impulse response filter used to analyze a set of data points by creating a… …   Wikipedia

Share the article and excerpts

Direct link
Do a right-click on the link above
and select “Copy Link”